Problem
Network health and speed test results have always been a pain point for ISP’s. Through extensive user interviews and testing, we’ve found that often customers are not given enough education and information about what their speed test results actually mean and how to troubleshoot poor results.
“My internet speed is slow? Is it you or is it me?”
Internet customers often do not understand why their home internet speed may slower than what they have purchased, causing product dissatisfaction and increased support calls.
“I don’t understand why my speed test is telling me that my internet speed is fast, but my device
is running slow.”
Often, the problem is not the speed of the internet coming into the home, but rather other factors within the home such as modem placement, number of devices on a network, age/type of devices and many more.
Solution
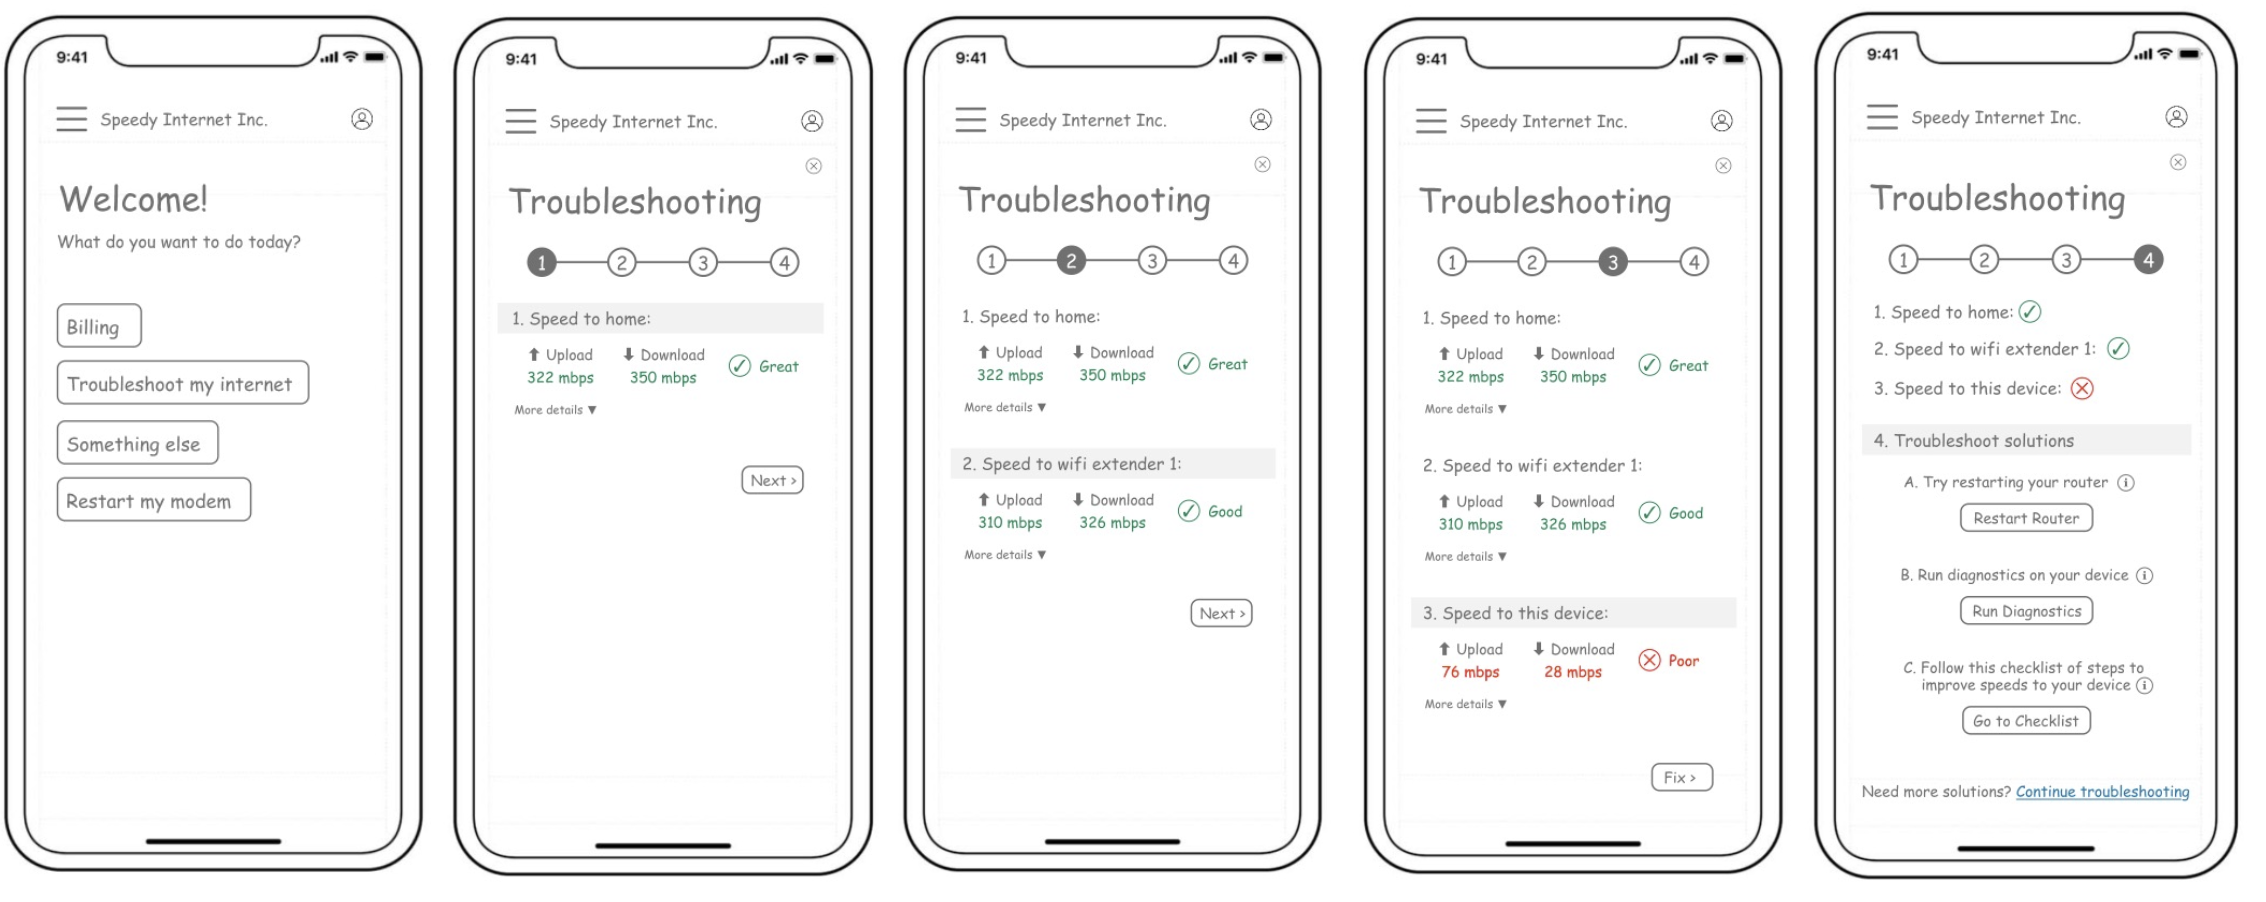
Redesign the Network Health & Speed Test flows where customers should be able to:
Quickly see their existing speeds (to Home / to Device)
Intuitively and visually understand the difference
Easily interact to get more info / understand better
Compare their existing speed (to Home) to their current plan
View historical results
Start down the right troubleshooting path (to Home/Internet or to Device/WiFi)
Success Criteria
If I can create a speed test journey that is educational and actionable, users will be empowered to interpret, manage, troubleshoot and upgrade their internet speeds, resulting in a 10% call reduction, improved user engagement score and future sales KPIs tied to upselling/upgrading speeds.
My Role
Lead UX/UI Designer, Information Architecture, User Research, Interface Design, Prototyping & Testing
User Research
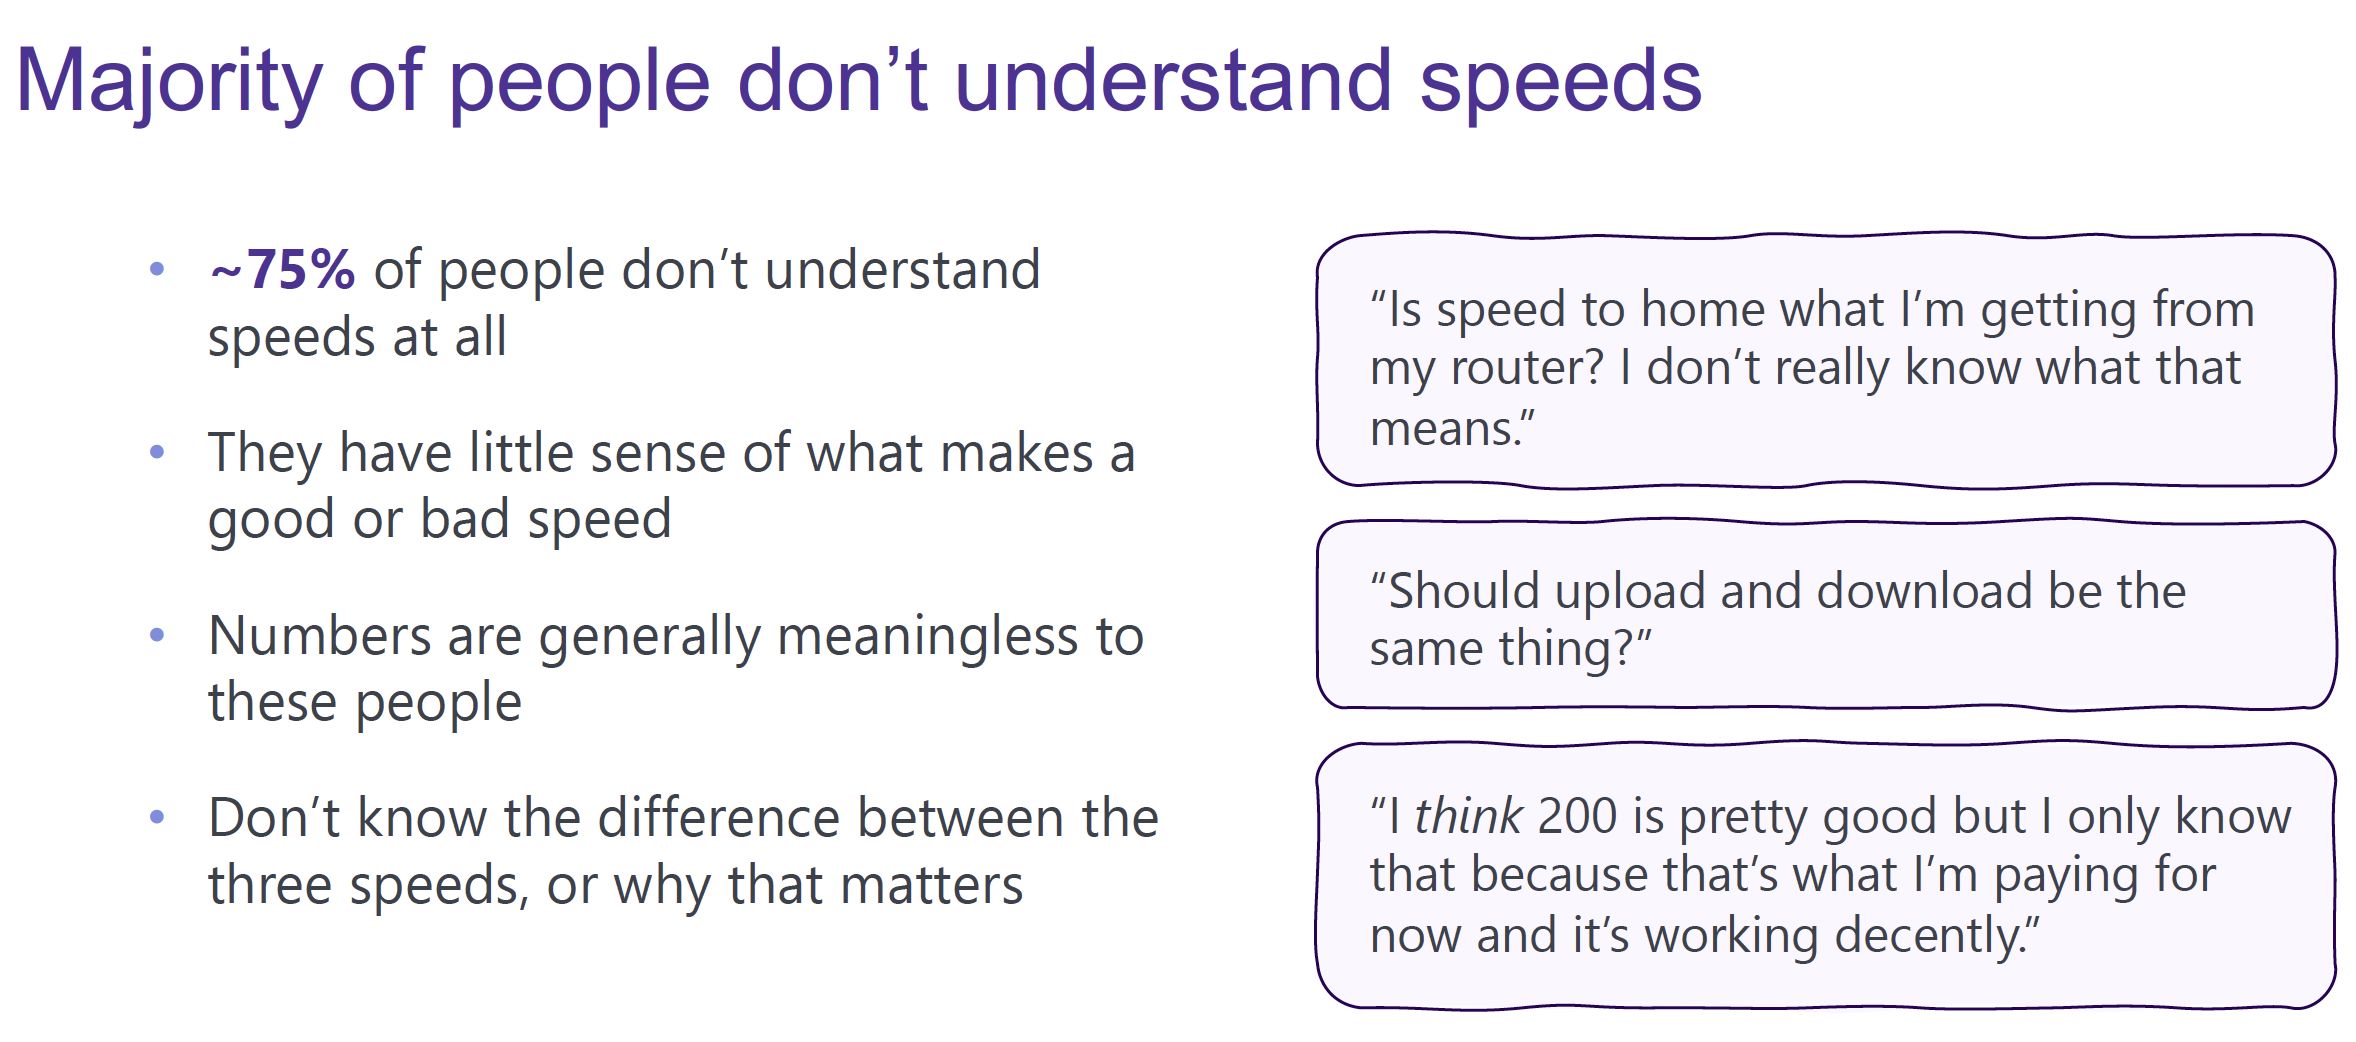
Quantitative surveys, user testing, customer interviews and competitive research were conducted. Primary user questions were uncovered through these studies:
What is my speed?
What does the result mean?
Why is it slow?
How does it compare to what I paid for? (my current plan)
How do I fix it?
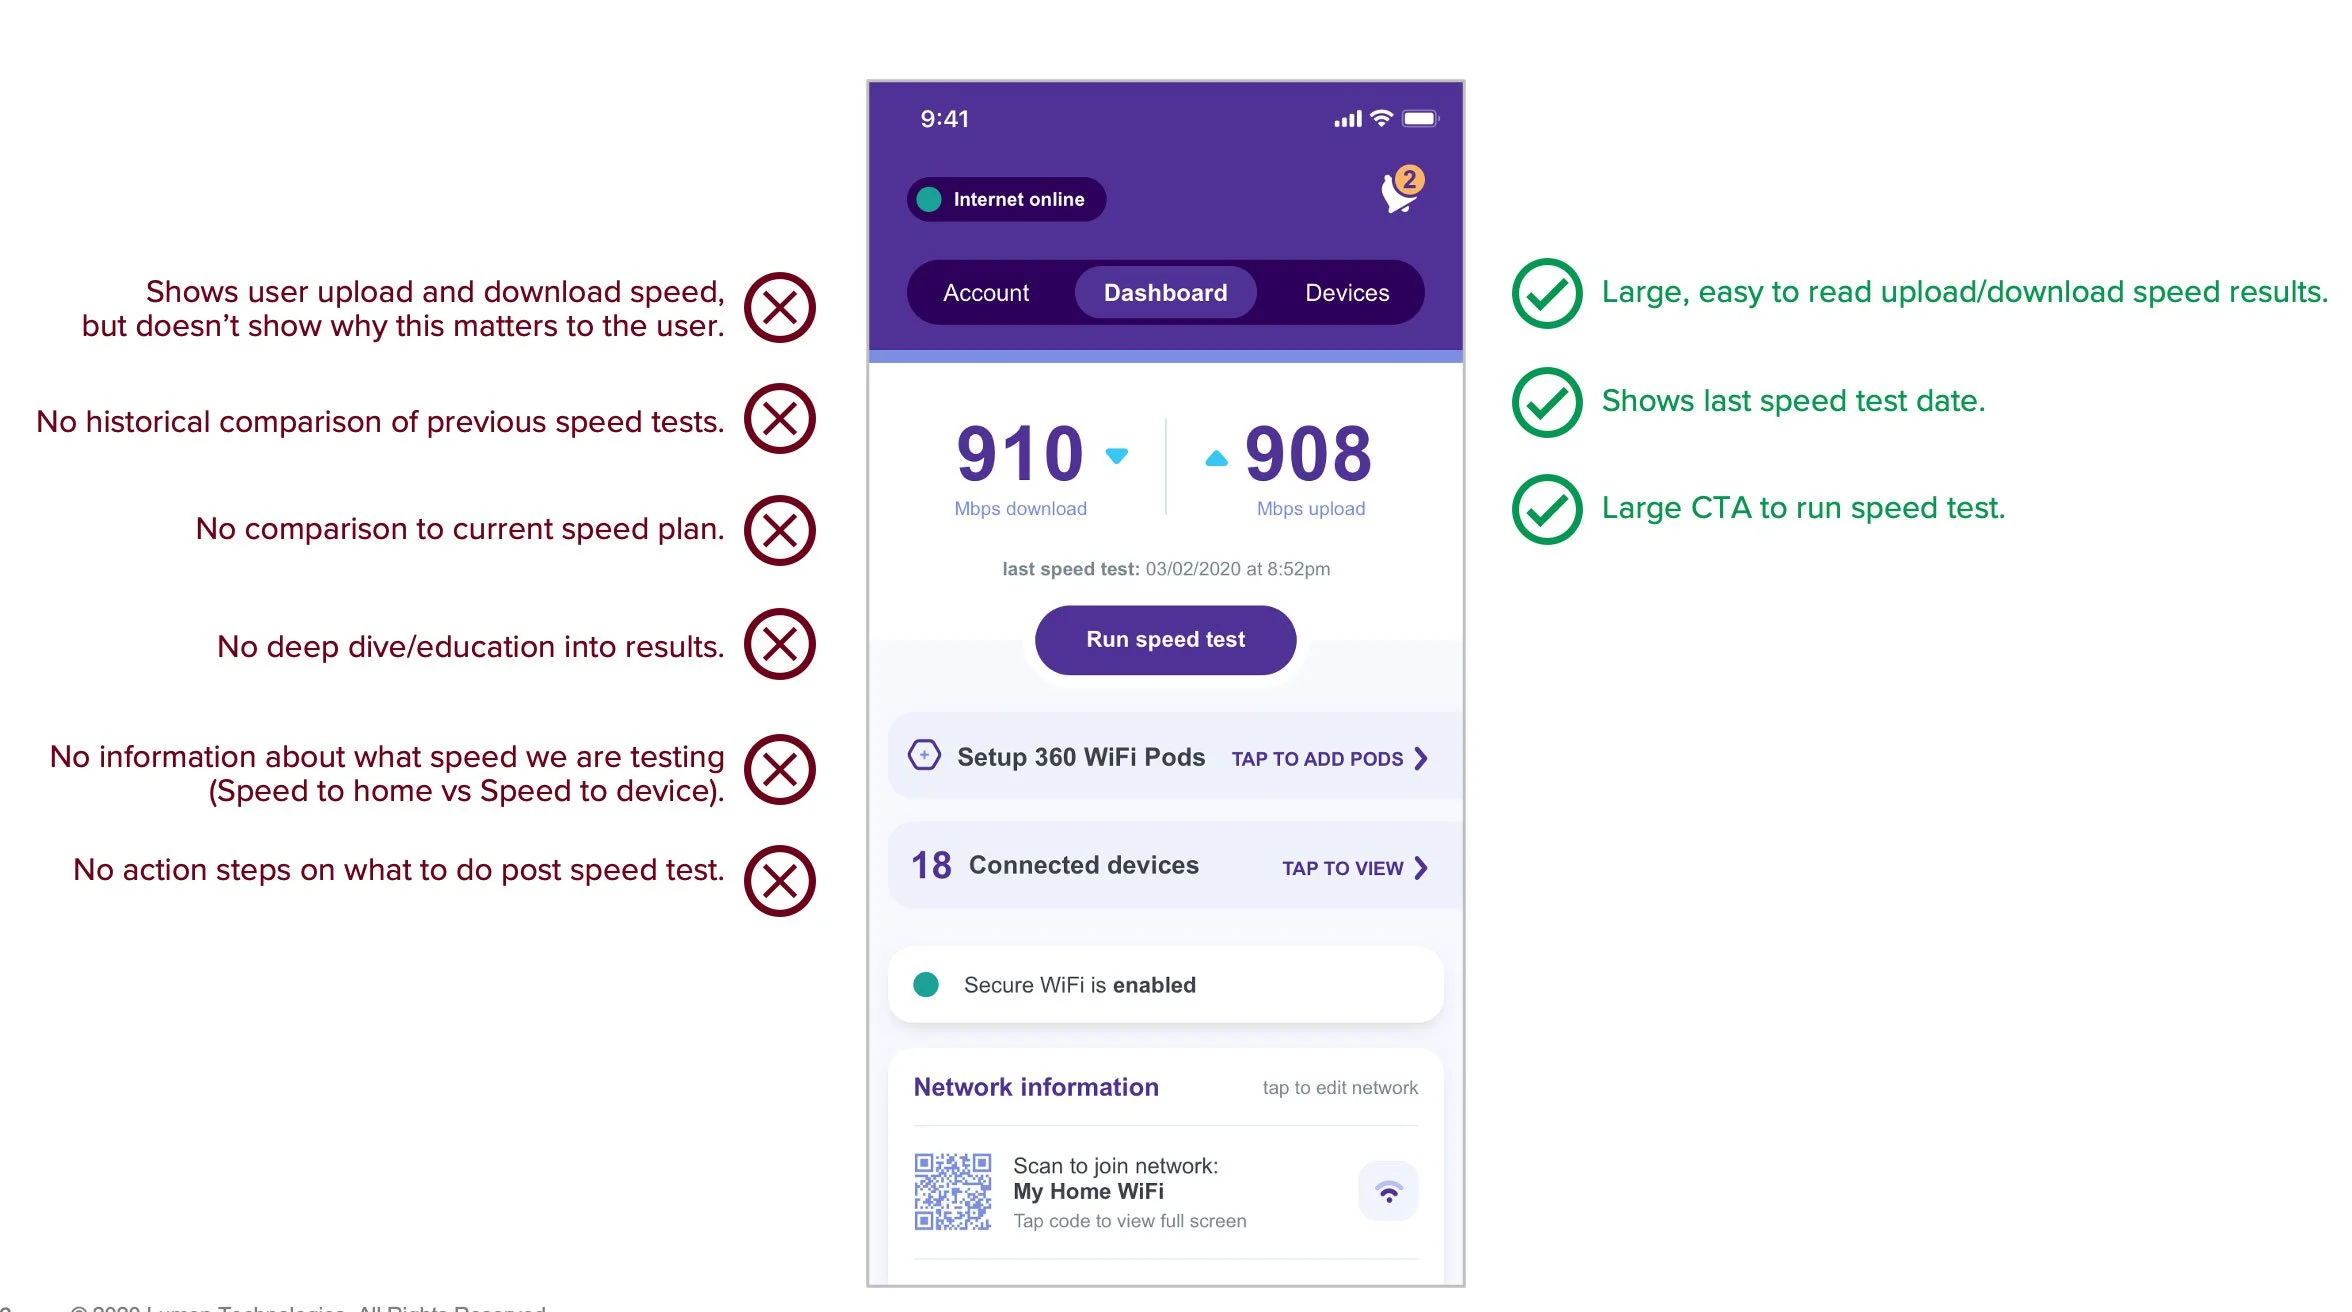
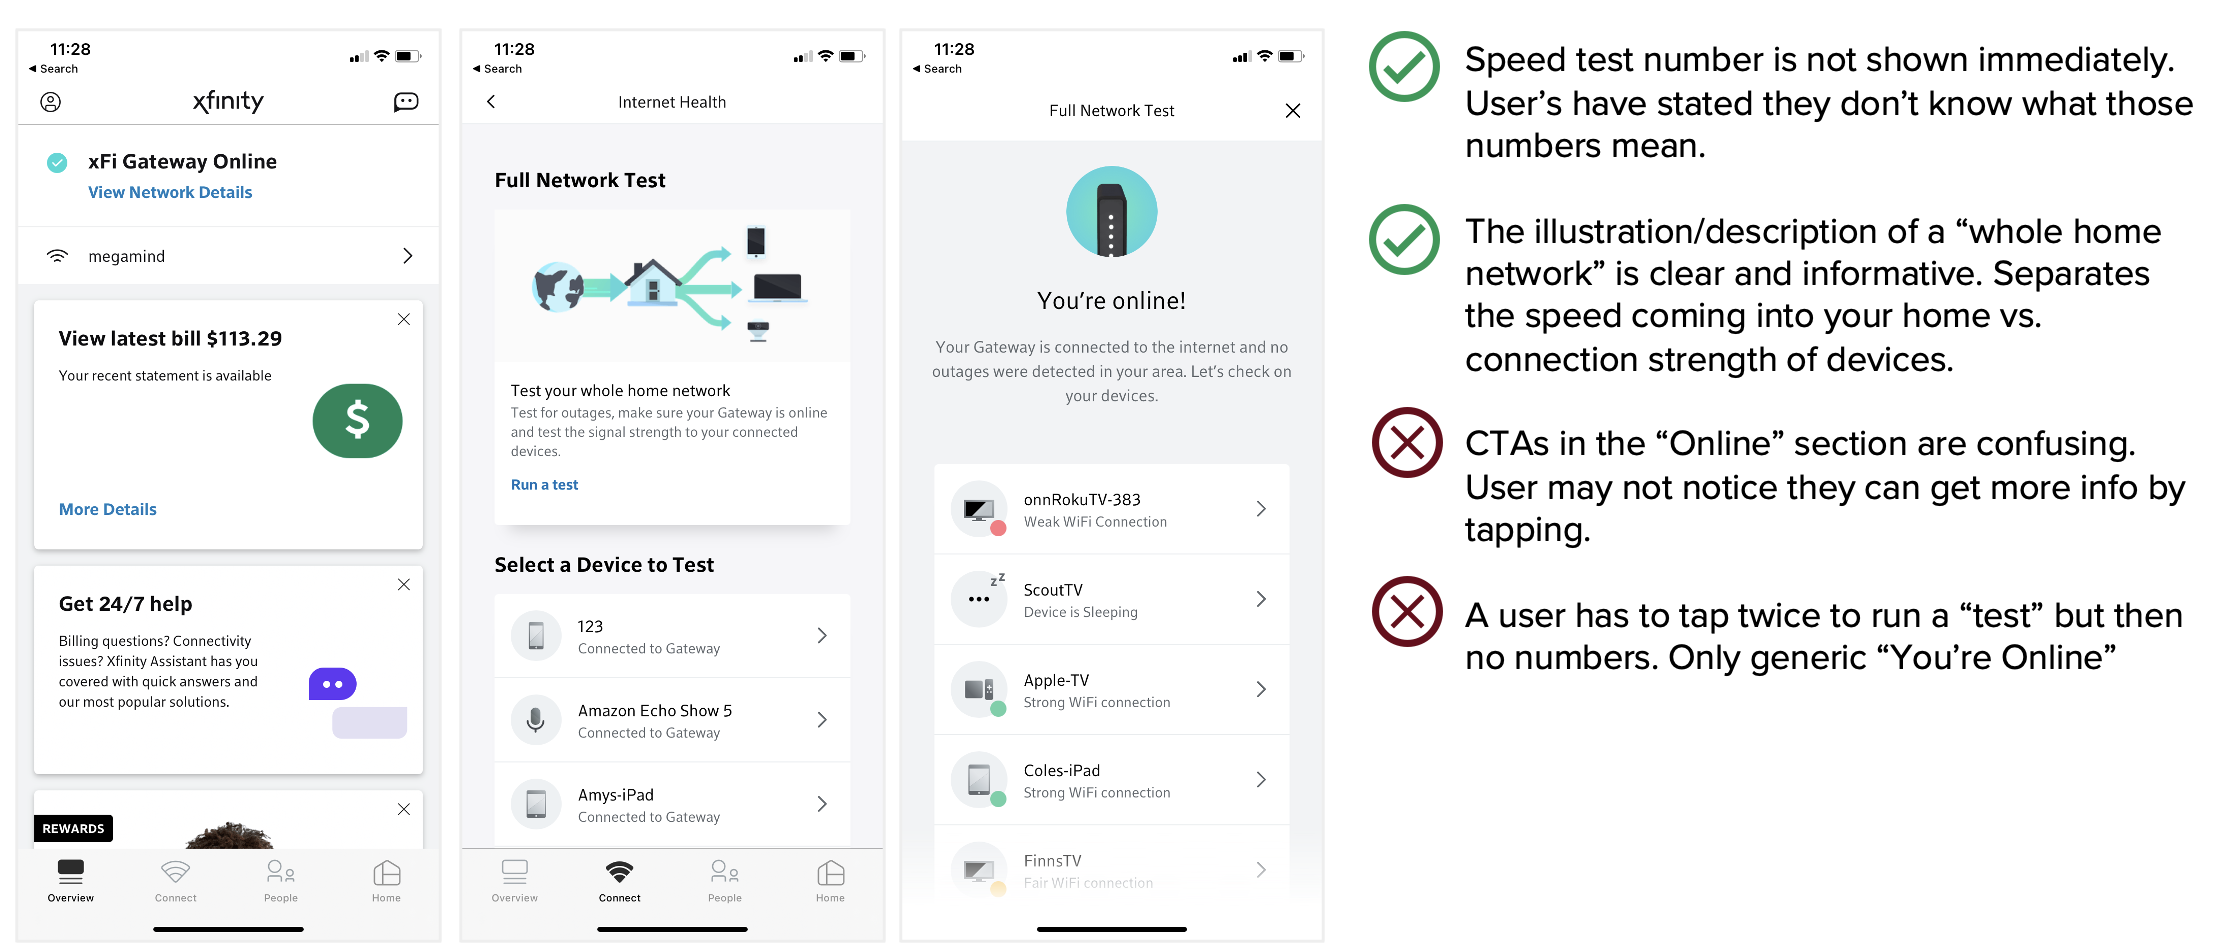
Existing UI
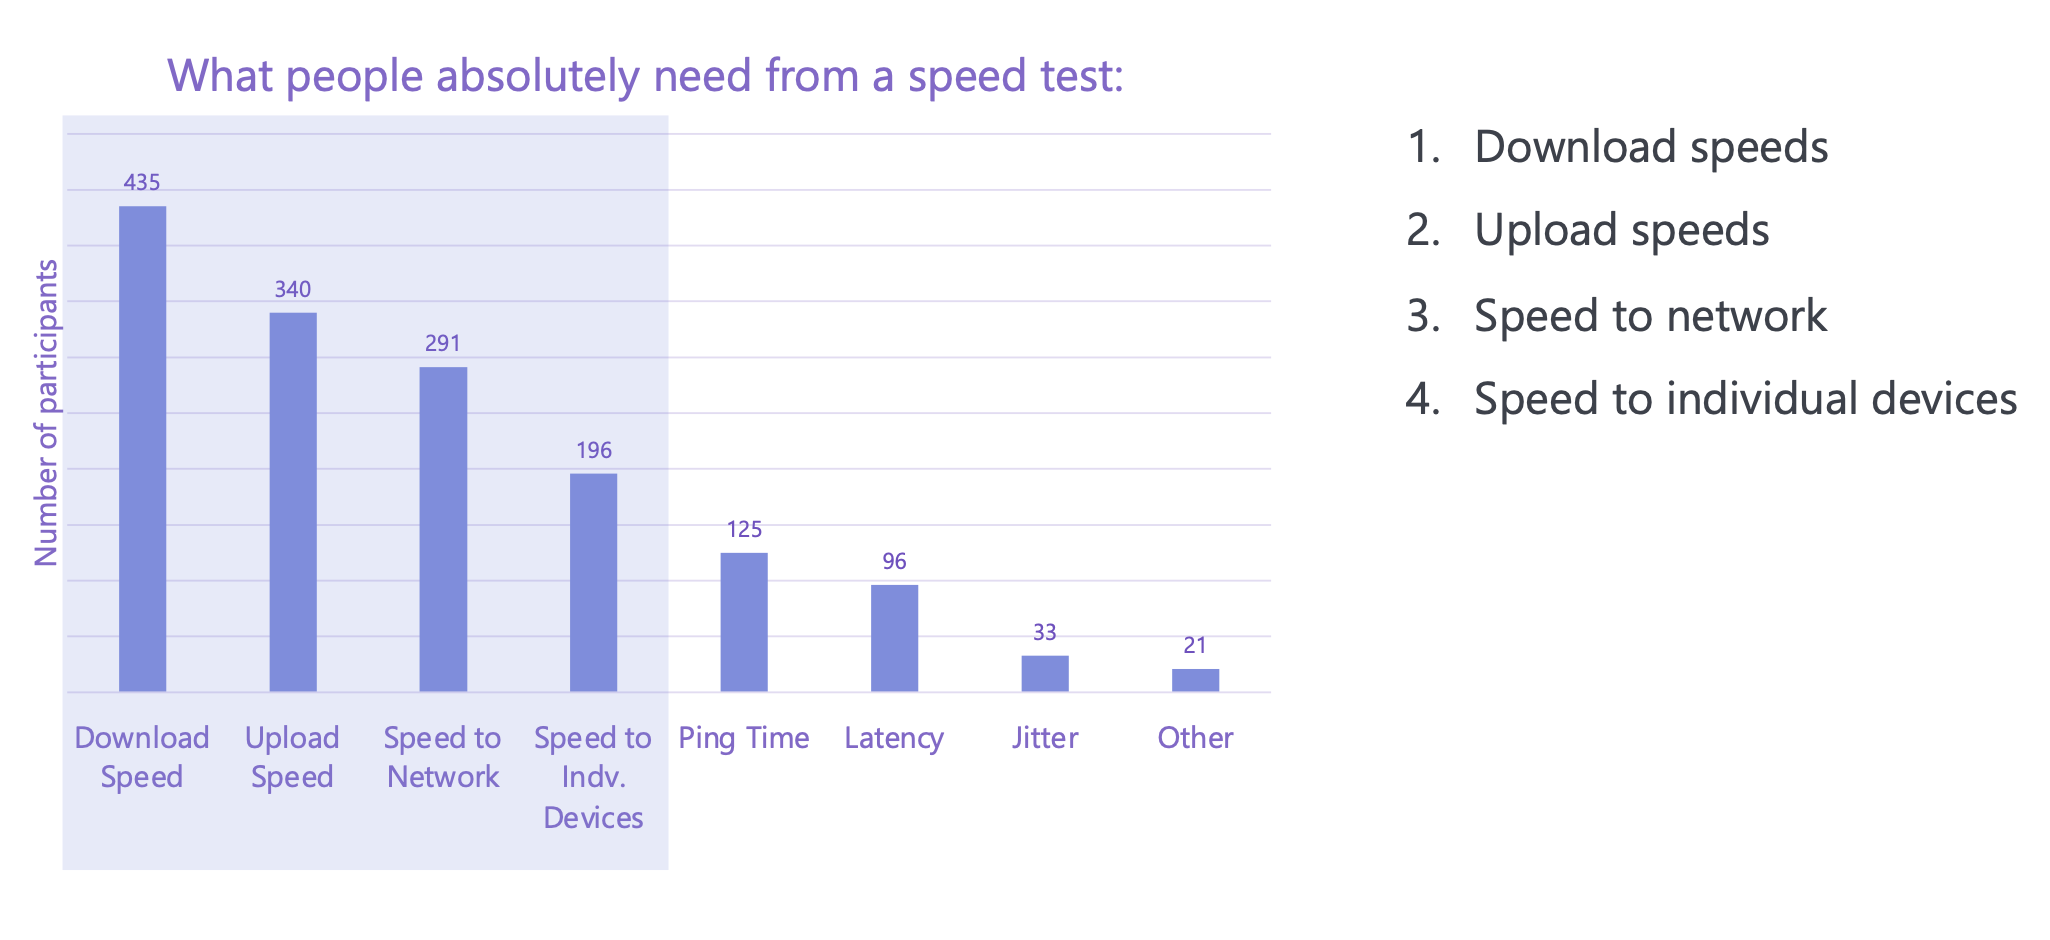
Survey Results
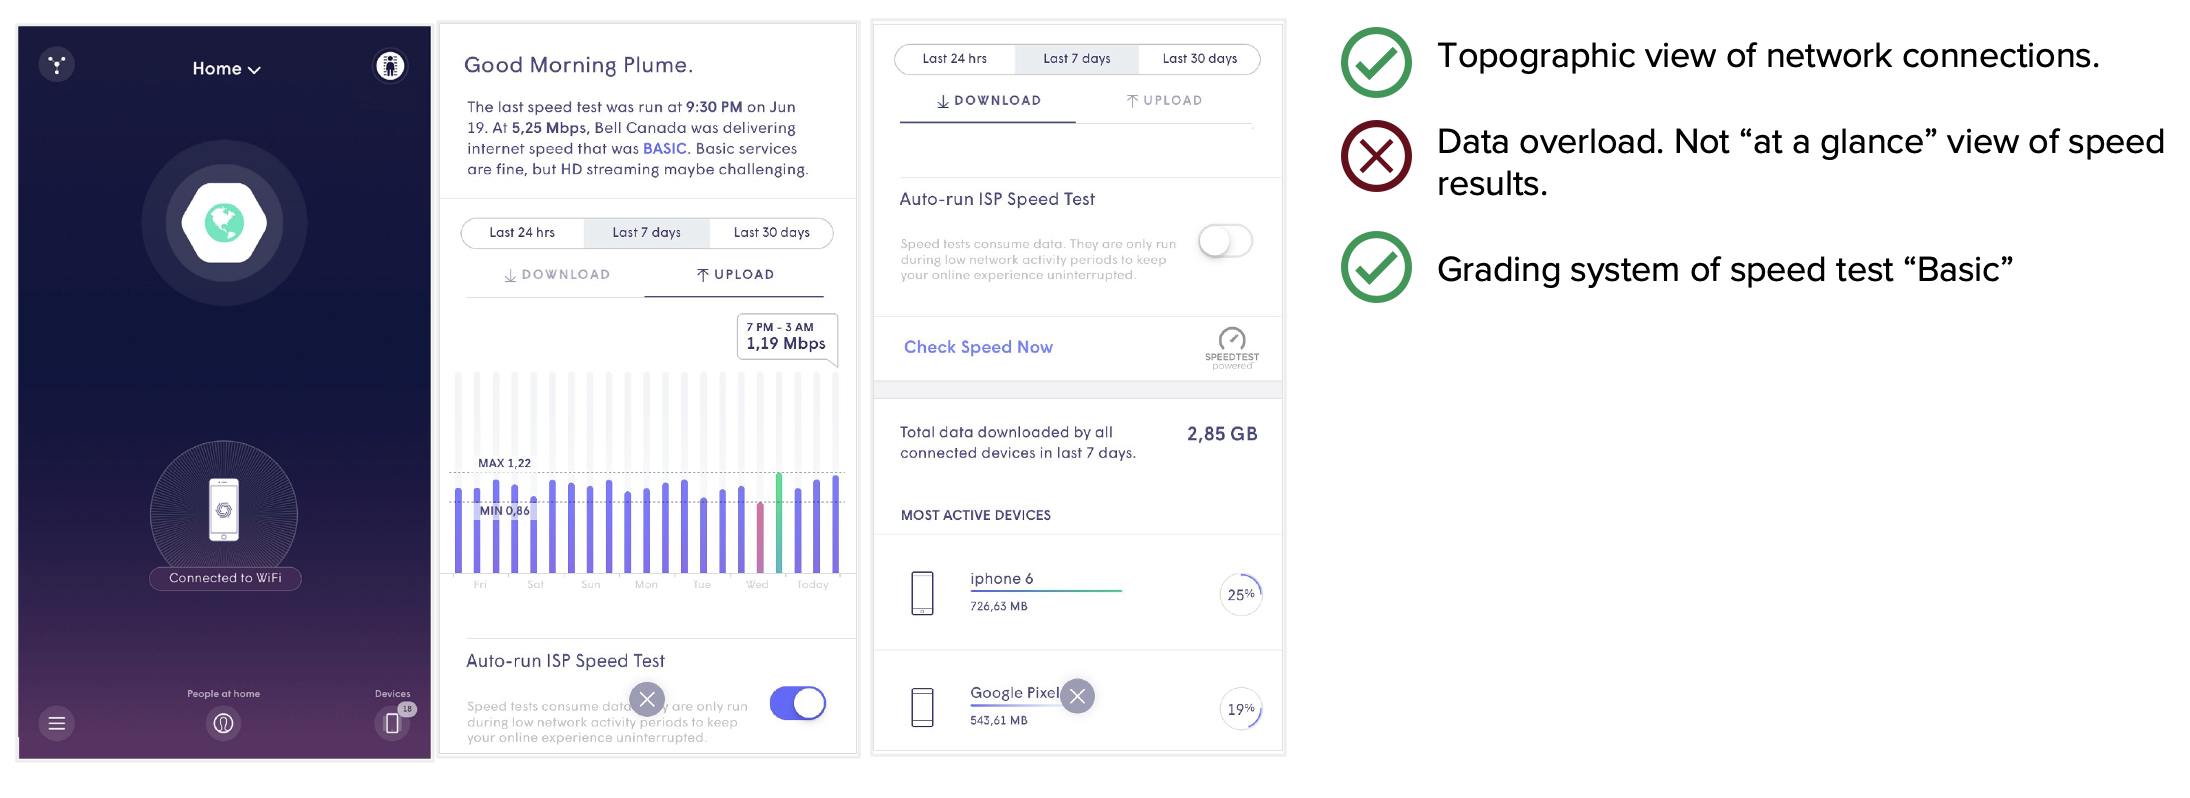
Competitive Research
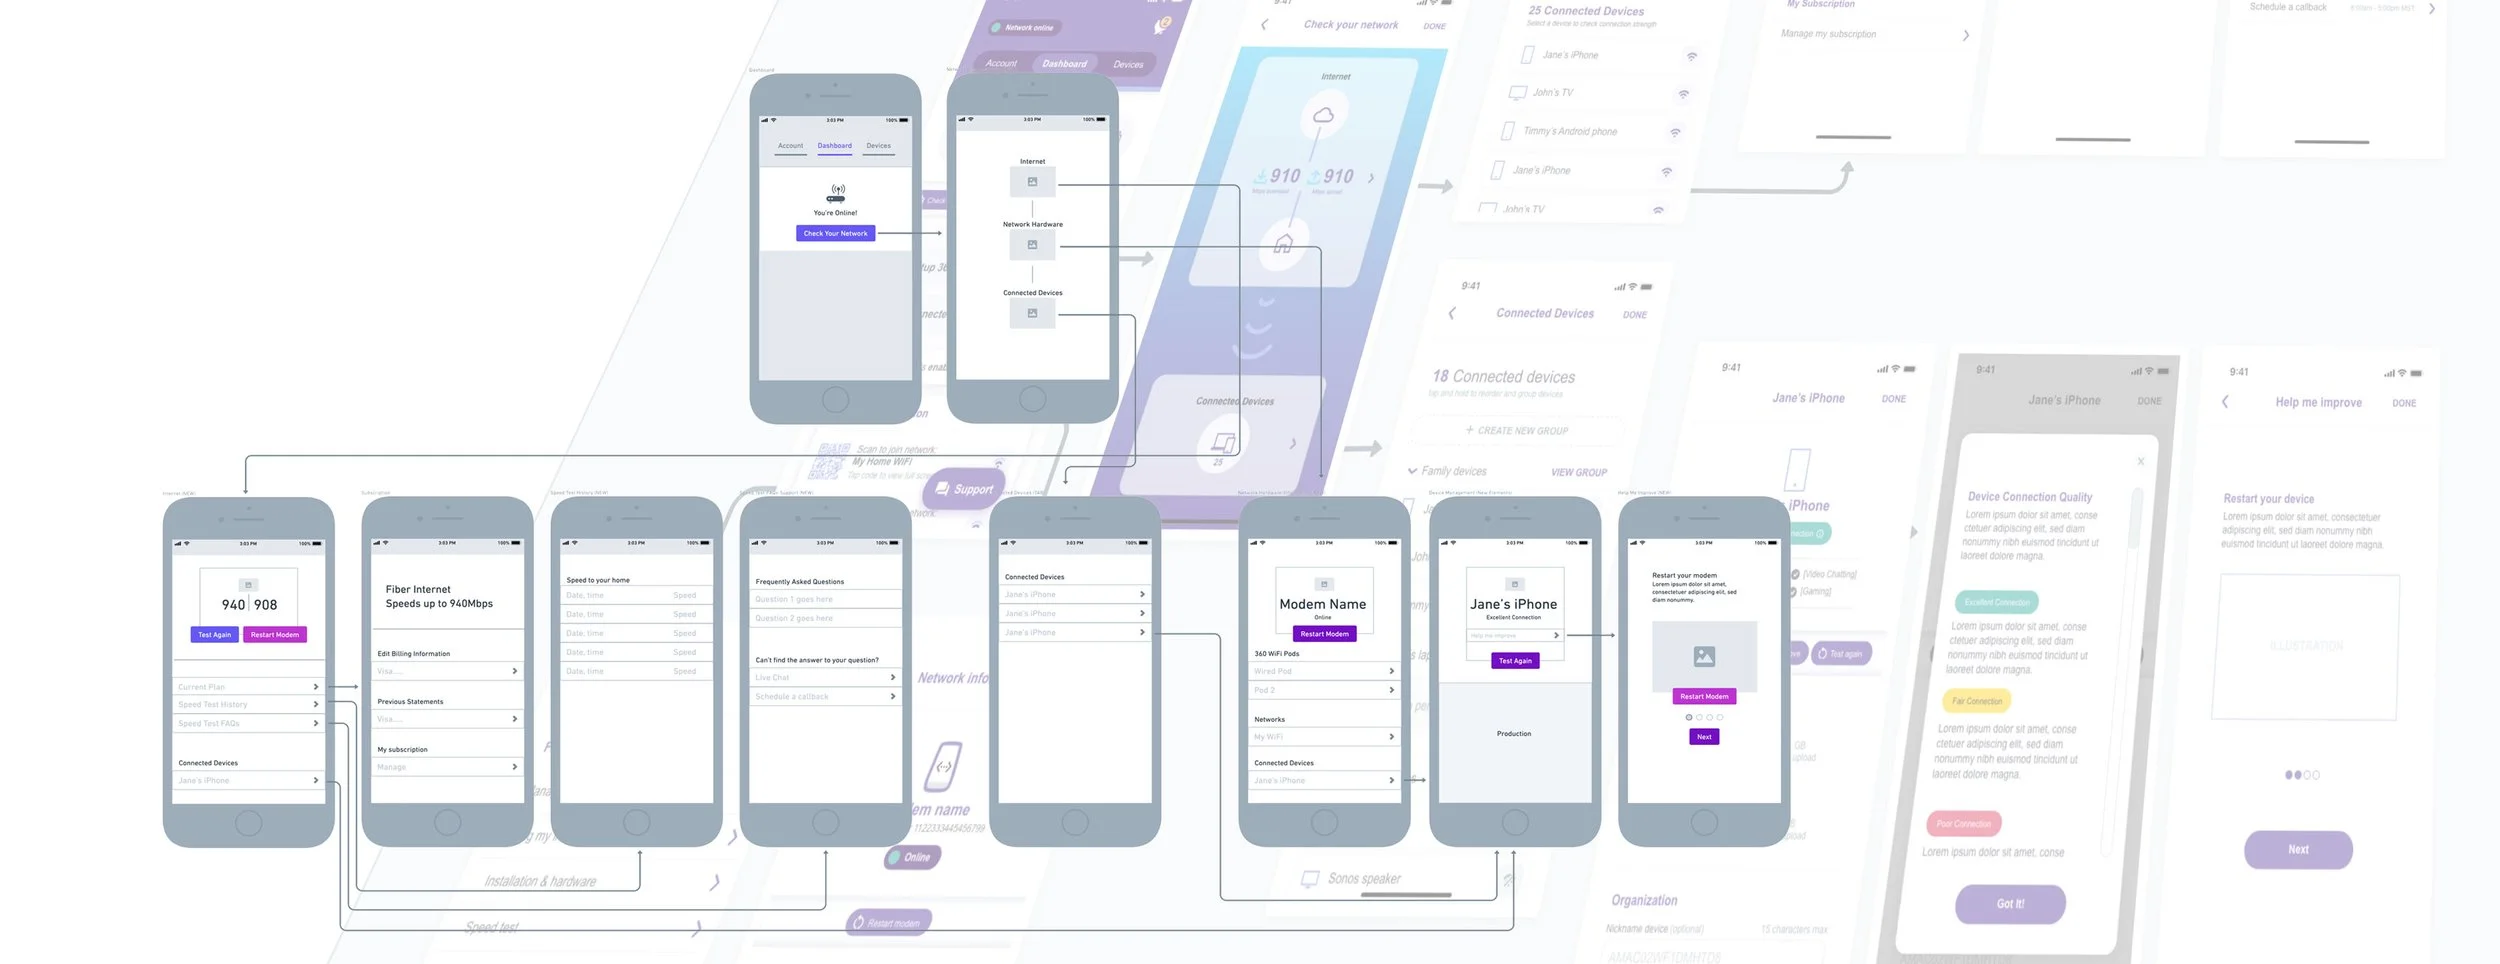
Discovery
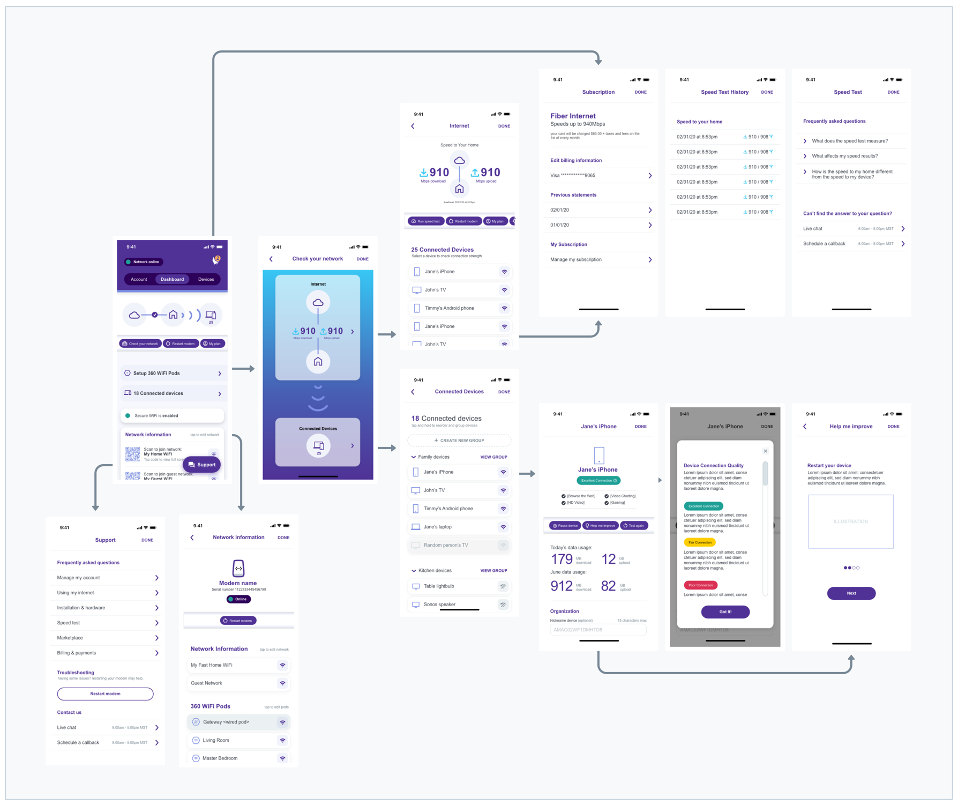
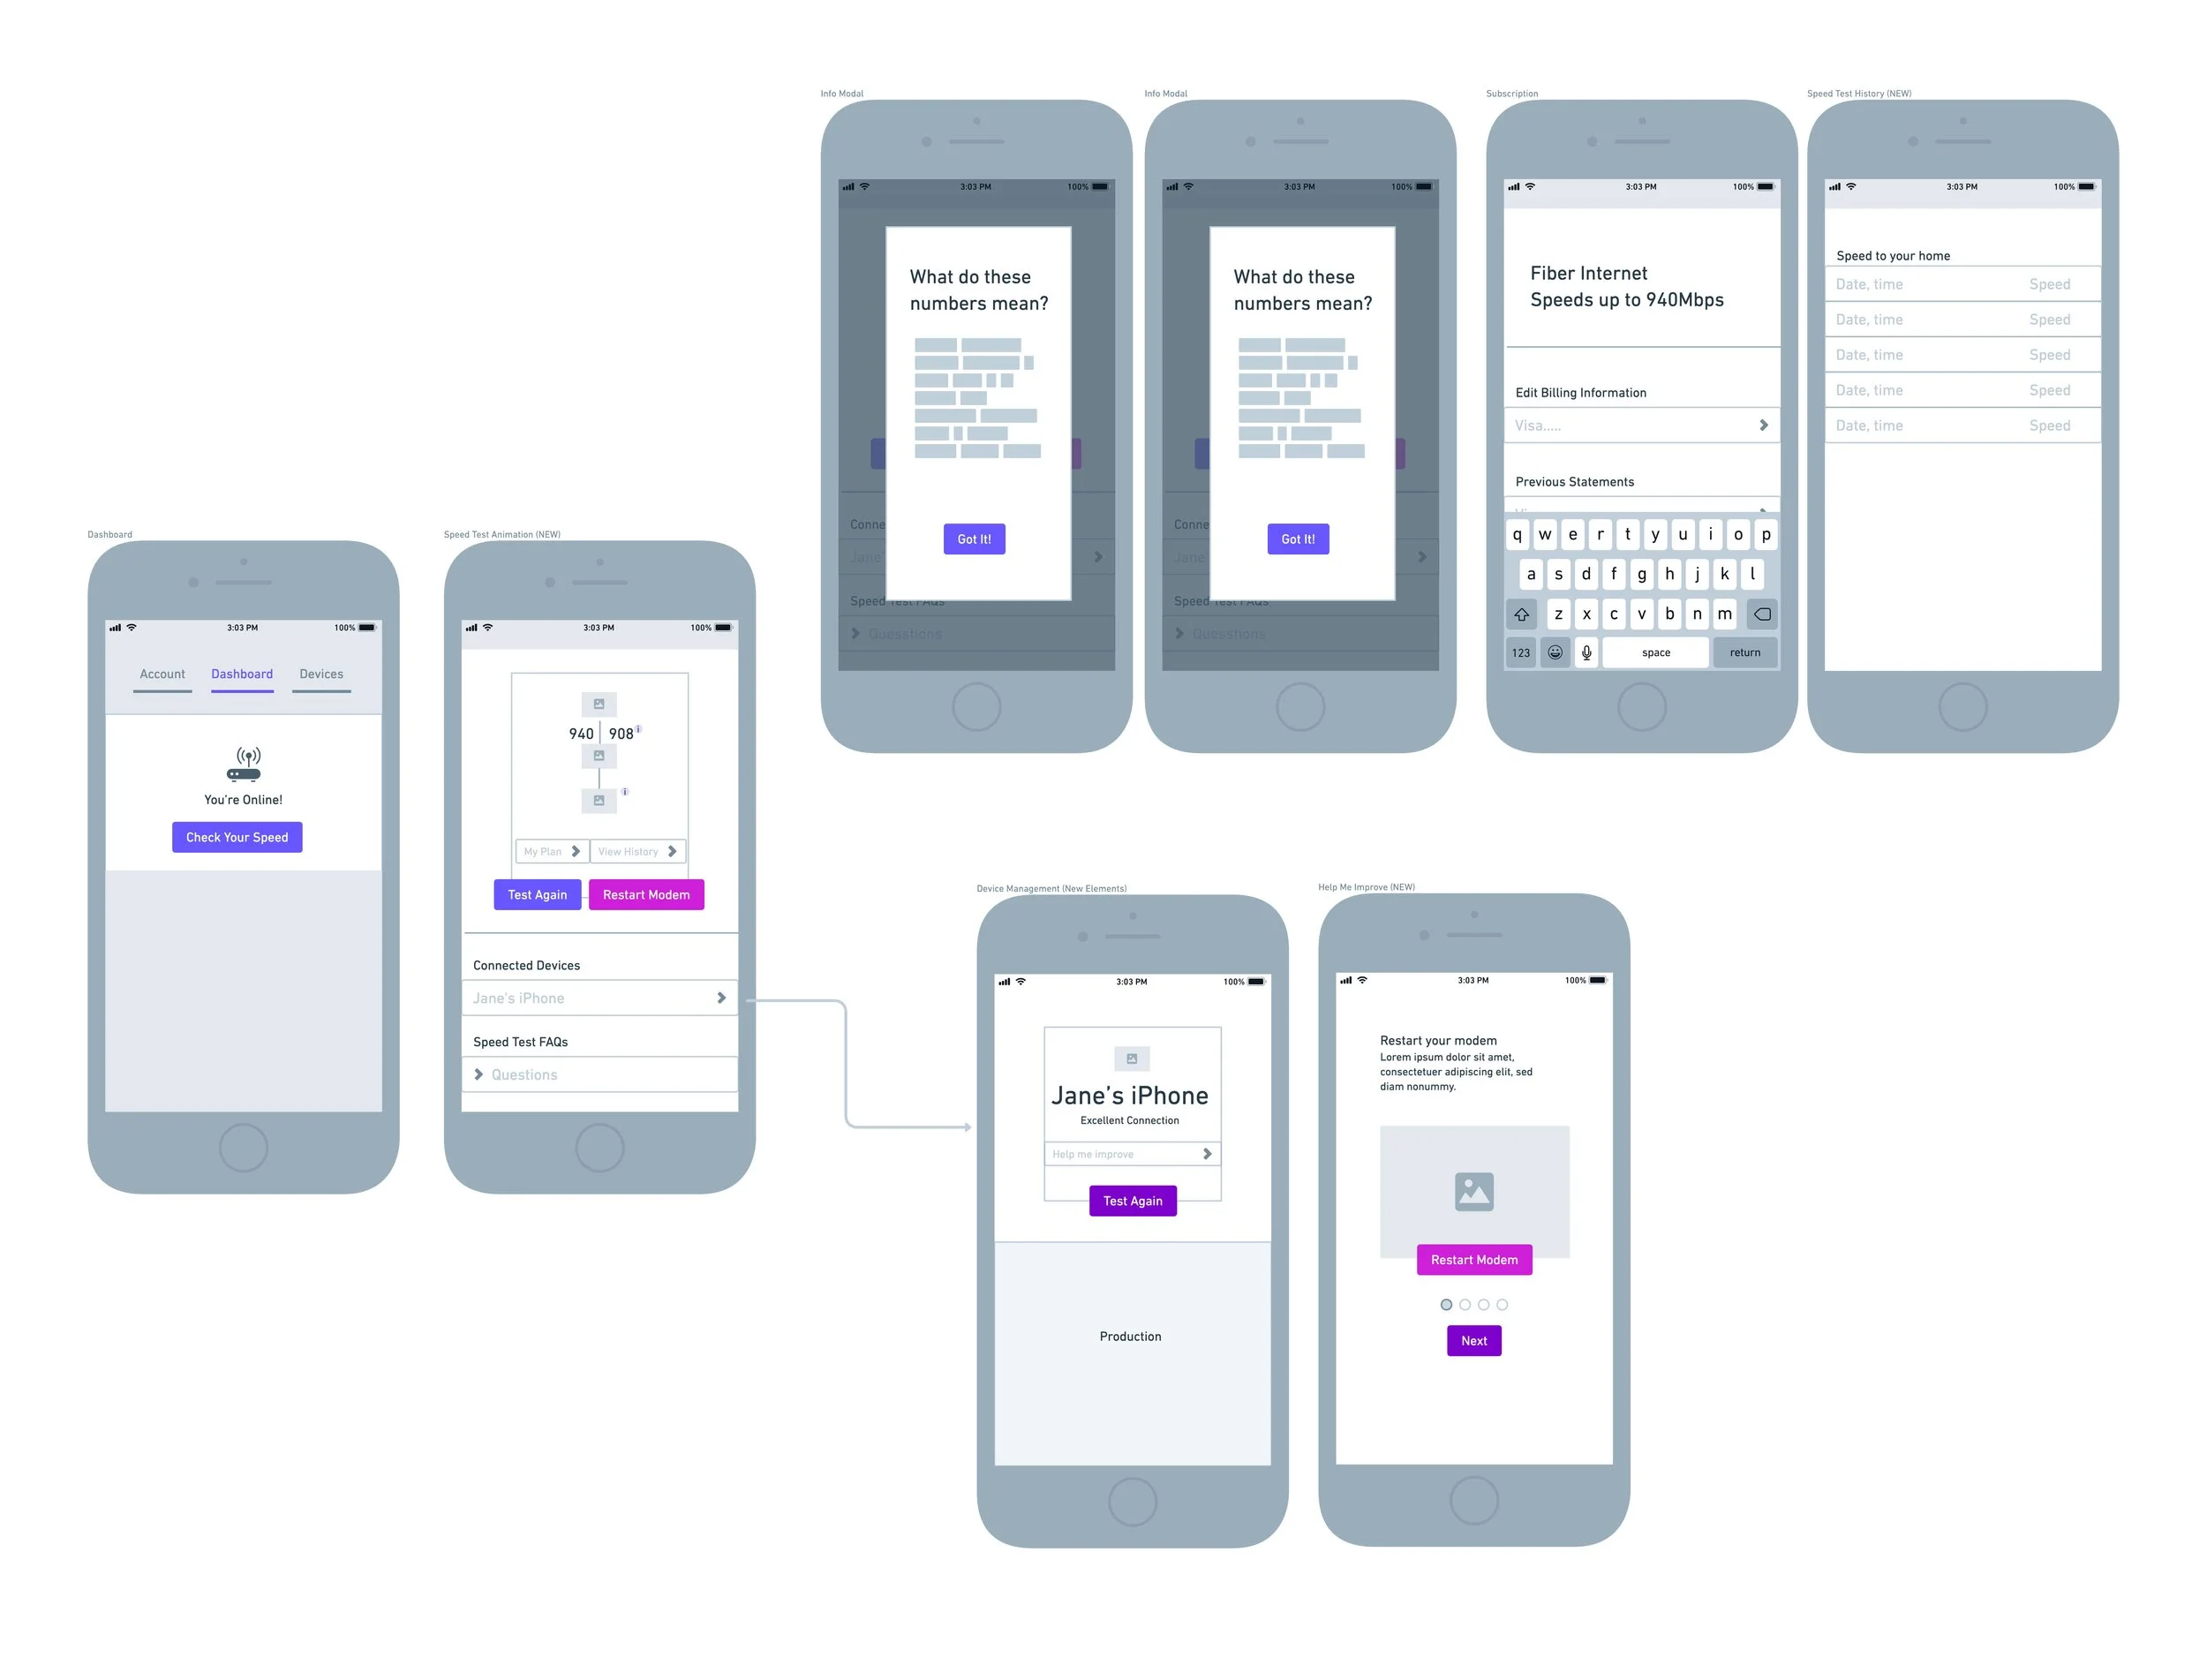
During the discovery phase of the project, I inventoried and assessed how I spoke about speed across all of our digital channels. I sketched, wireframed and tested different scenarios that helped me make the final recommendation for the new network health check and speed test.
The Final Design
The solution included many different touchpoints throughout the Quantum Fiber App. A visual animation on the dashboard of a customer’s general connectivity, a deeper dive into network health and connected devices, ability to view historical speed tests and troubleshooting tips and guides along the way.
A Closer Look
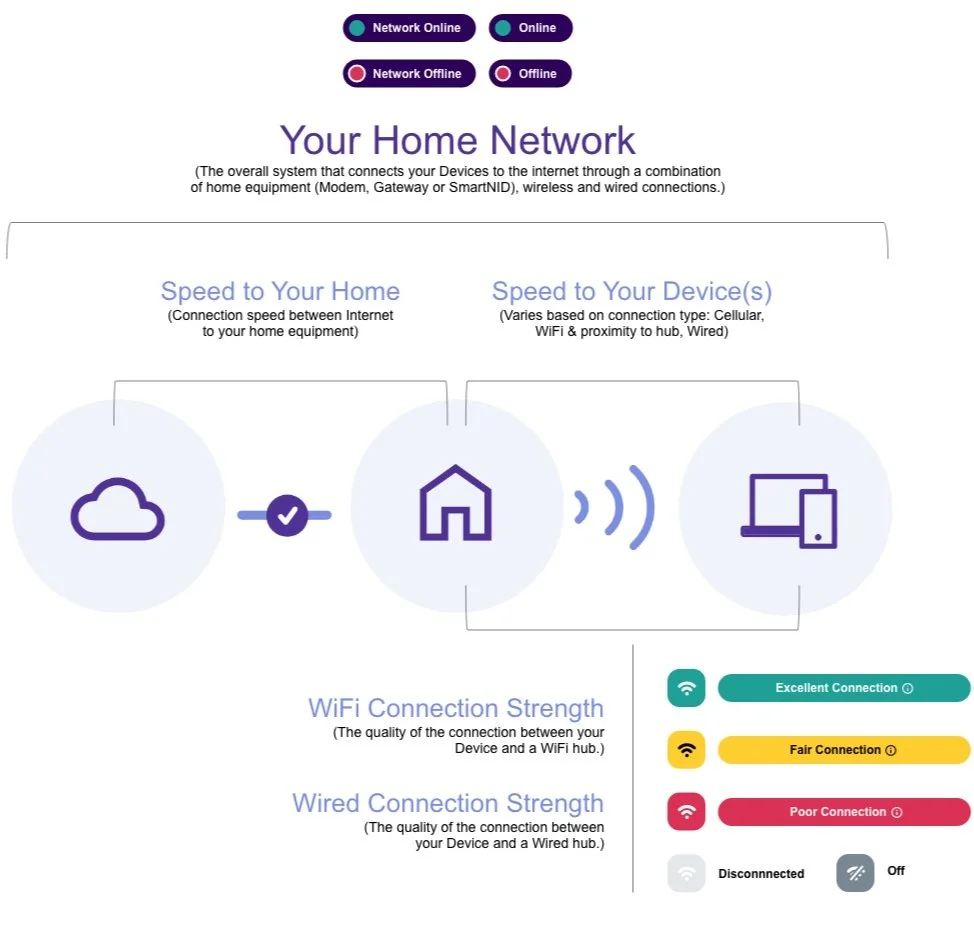
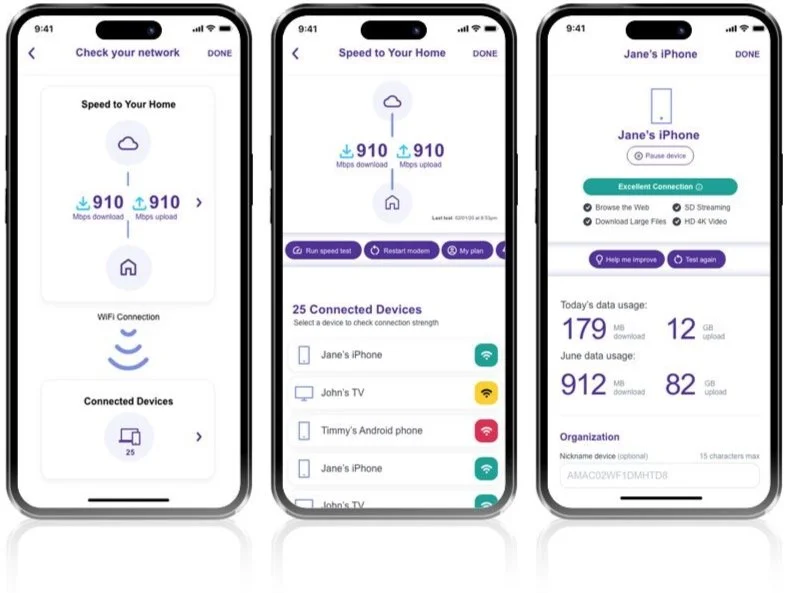
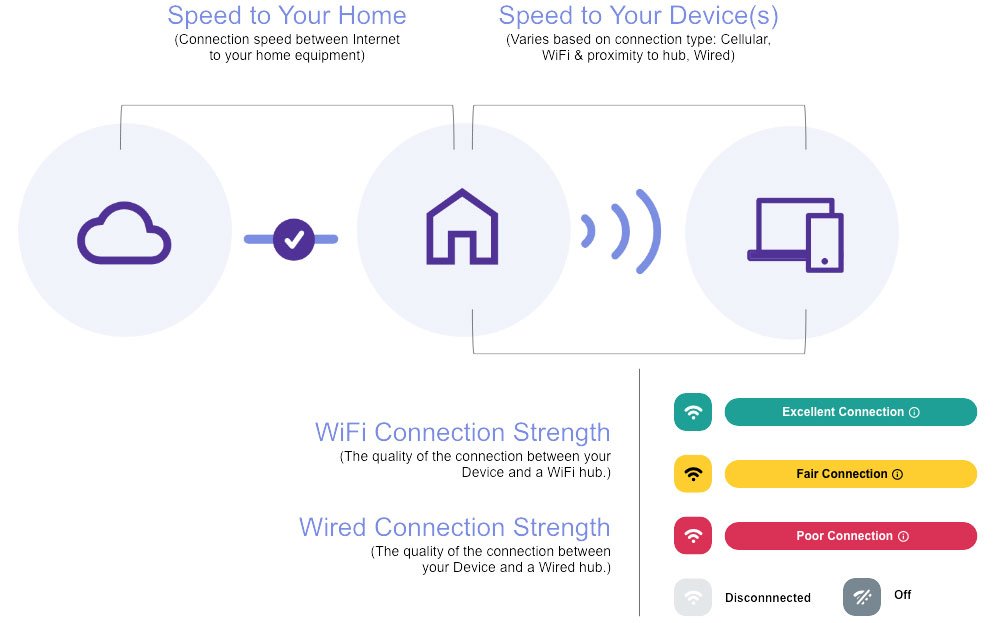
Animations & Iconography
Lottie animations were created to help a customer understand their network. Speed to their home vs. speed to their connected devices. Visual indicators and connectivity grades were also created.
A Closer Look
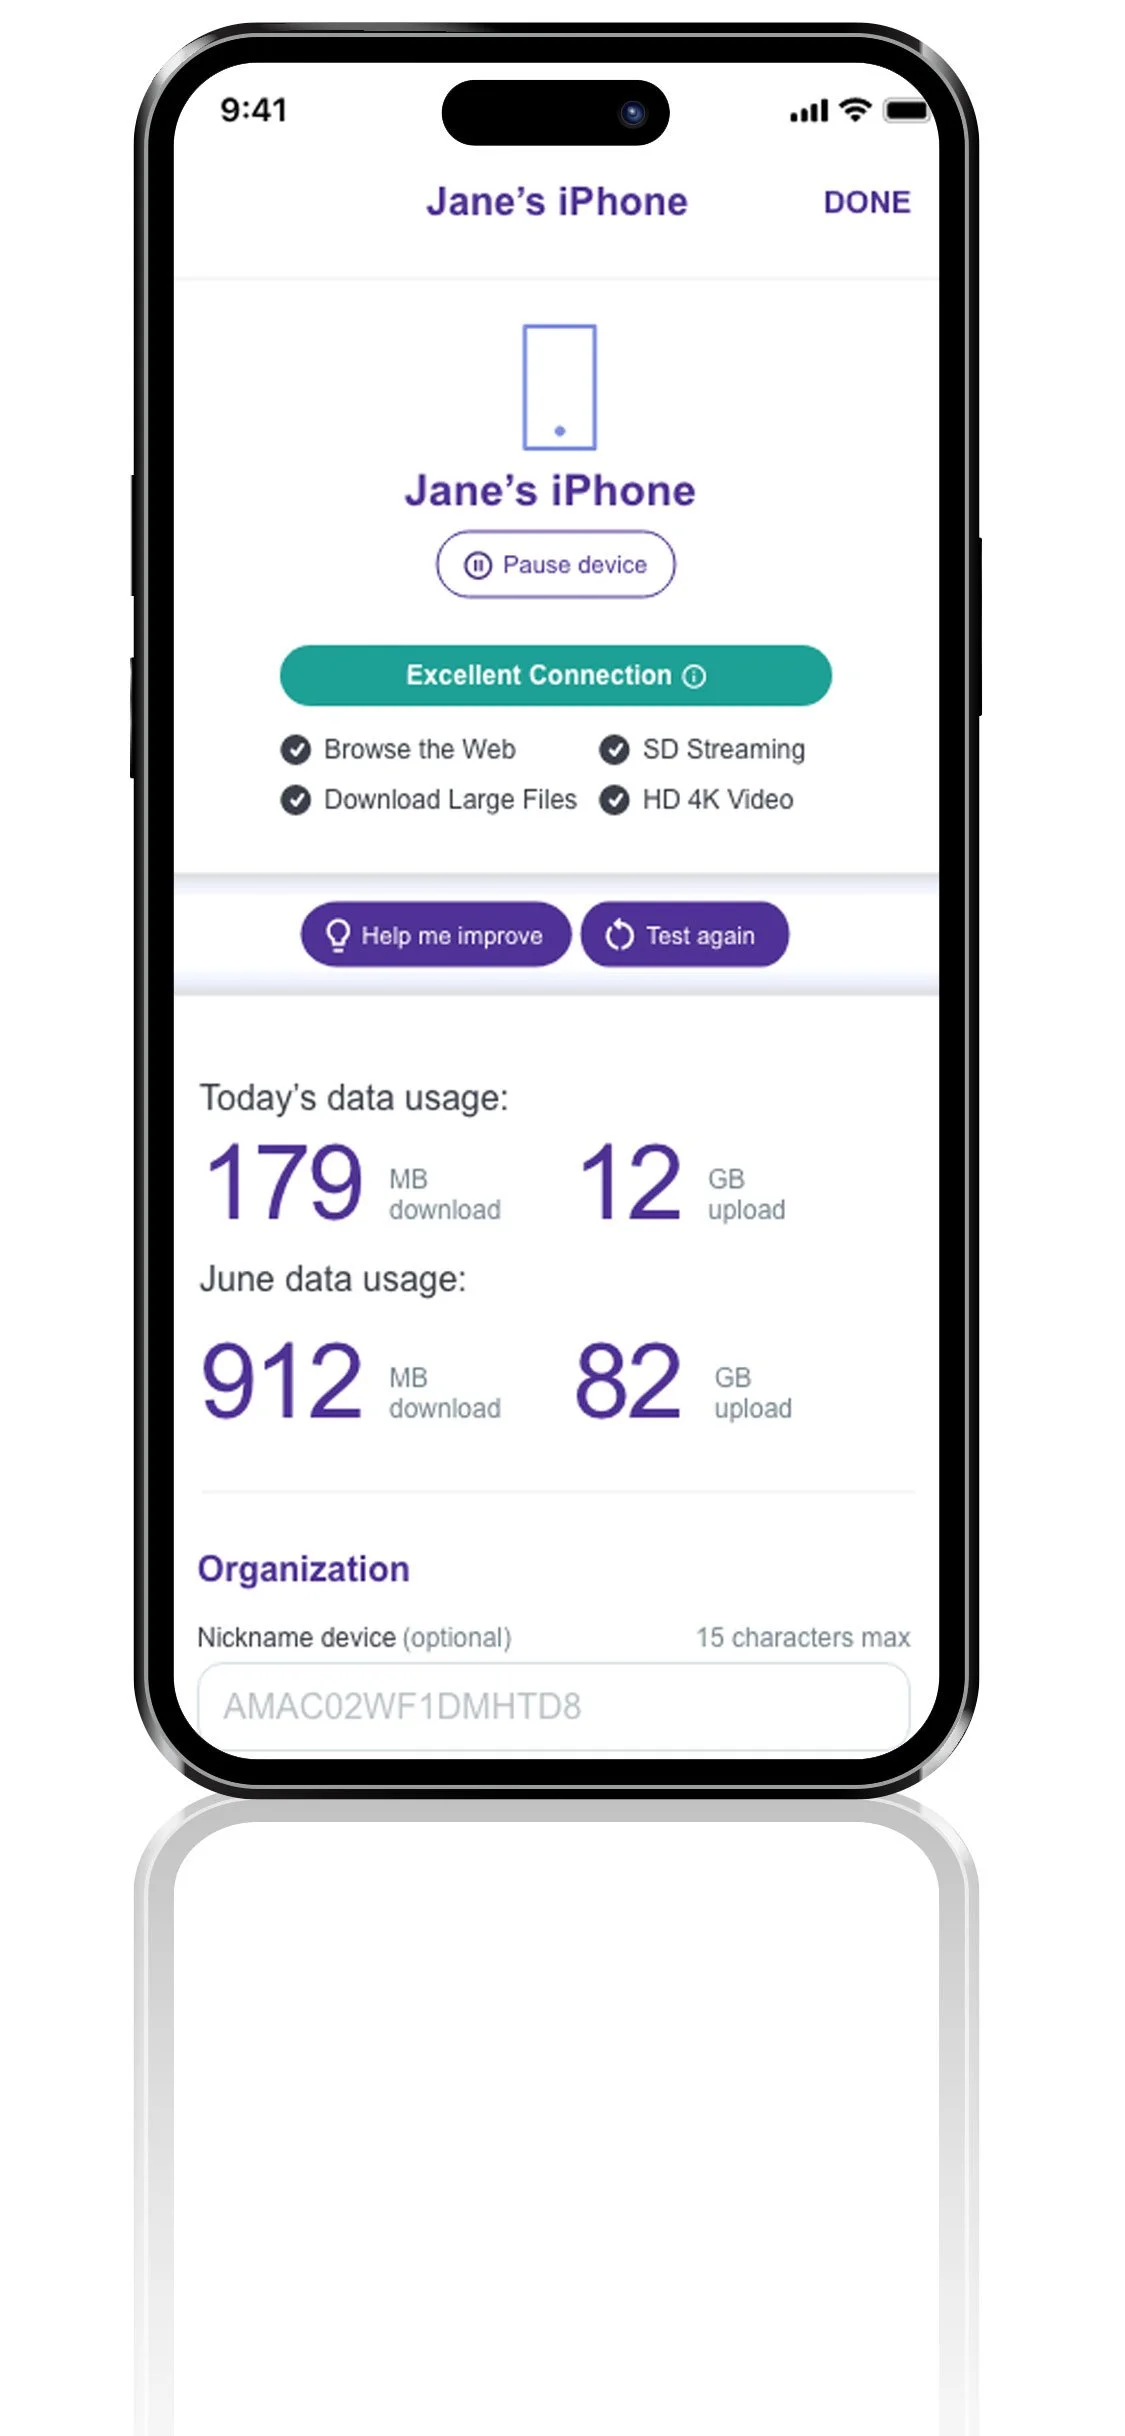
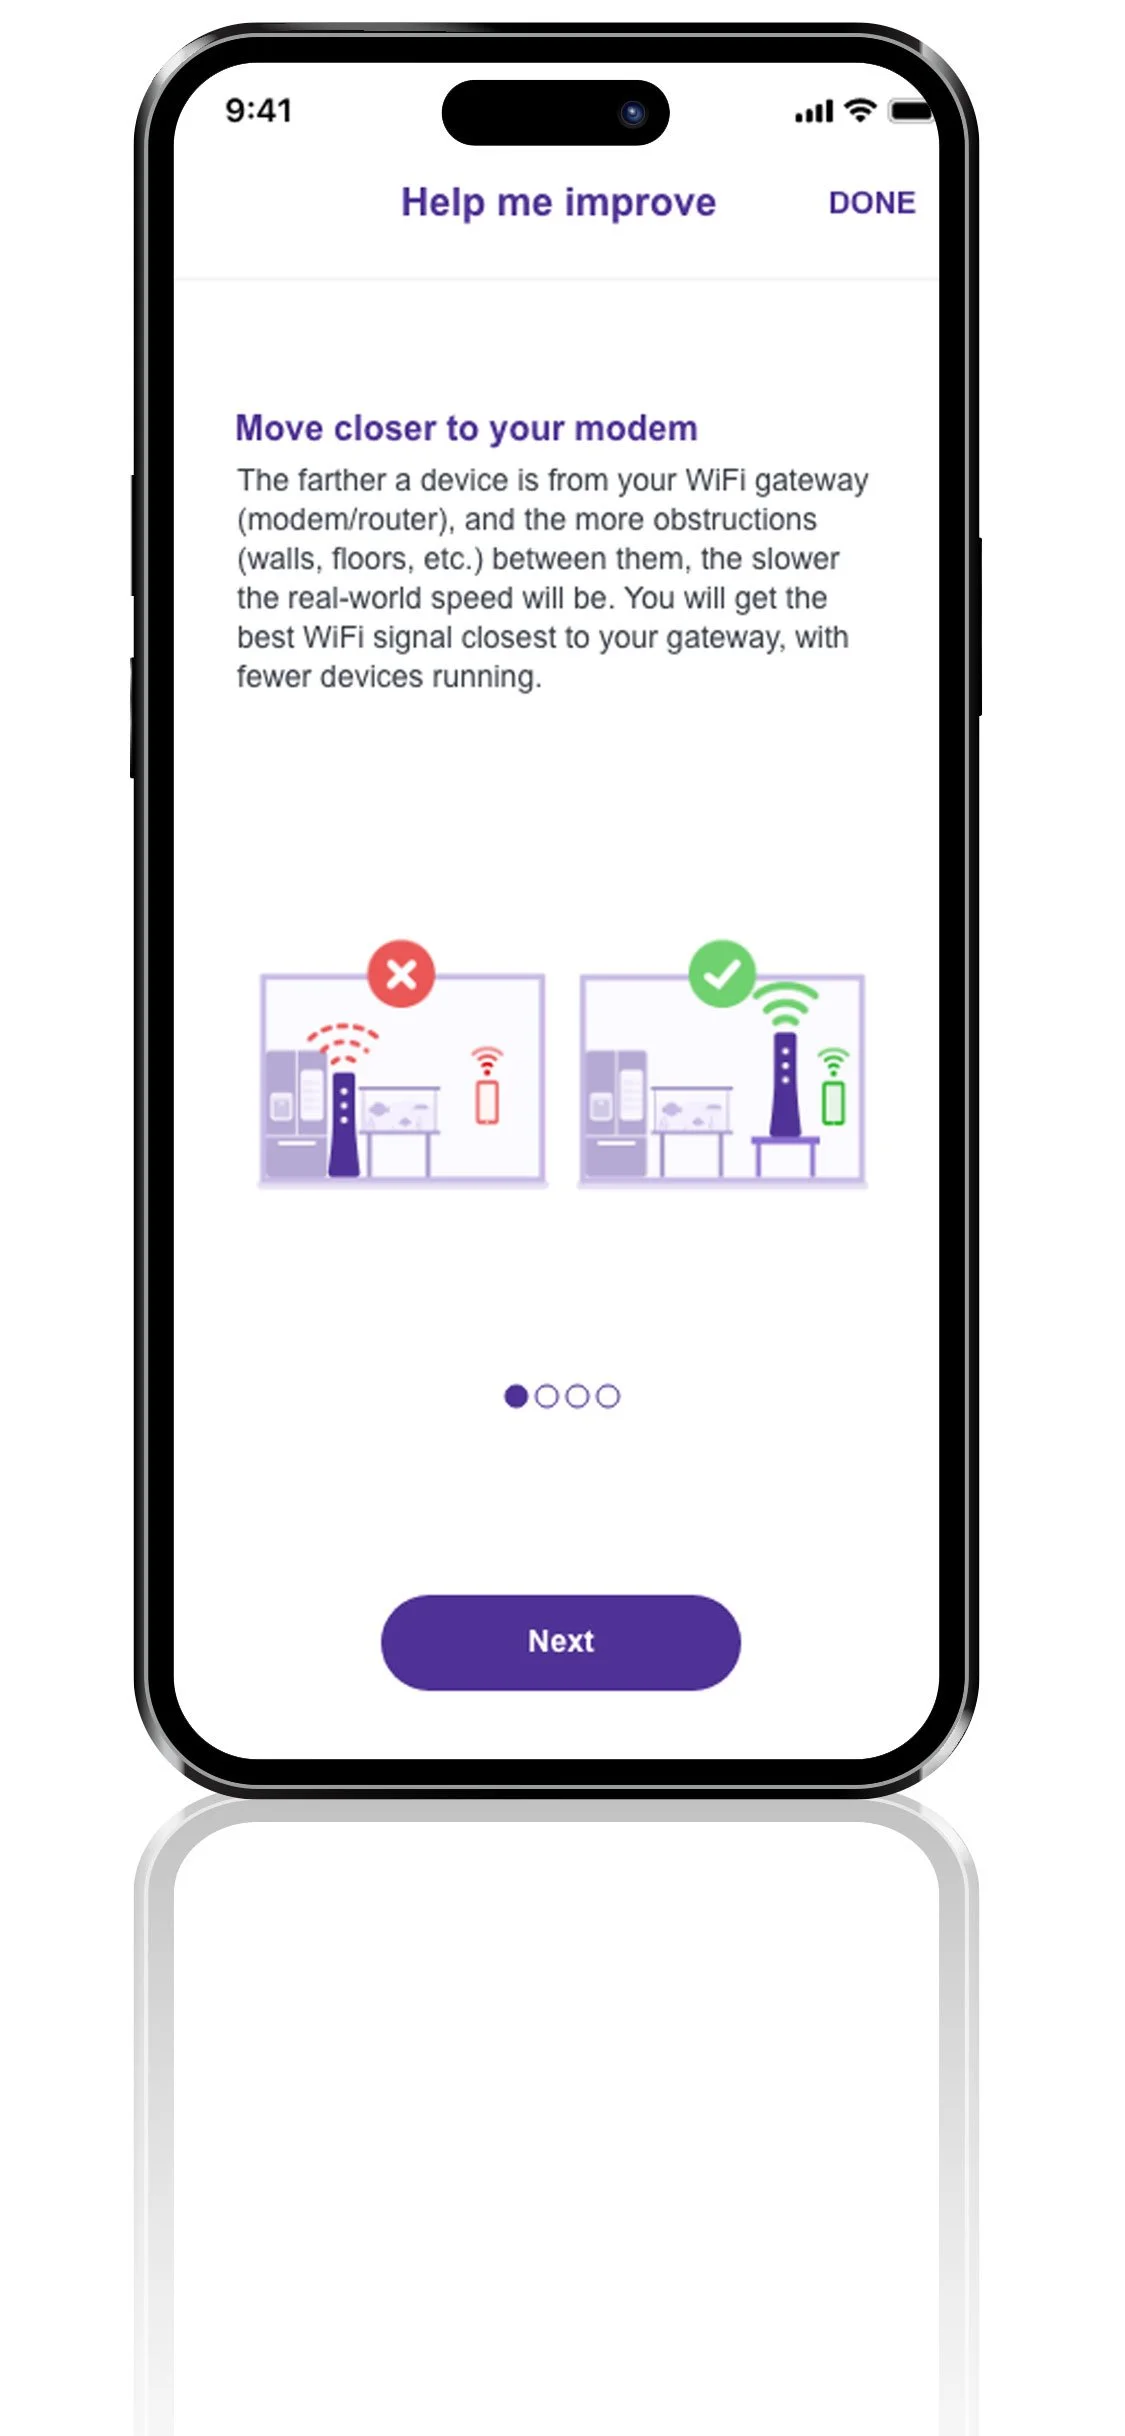
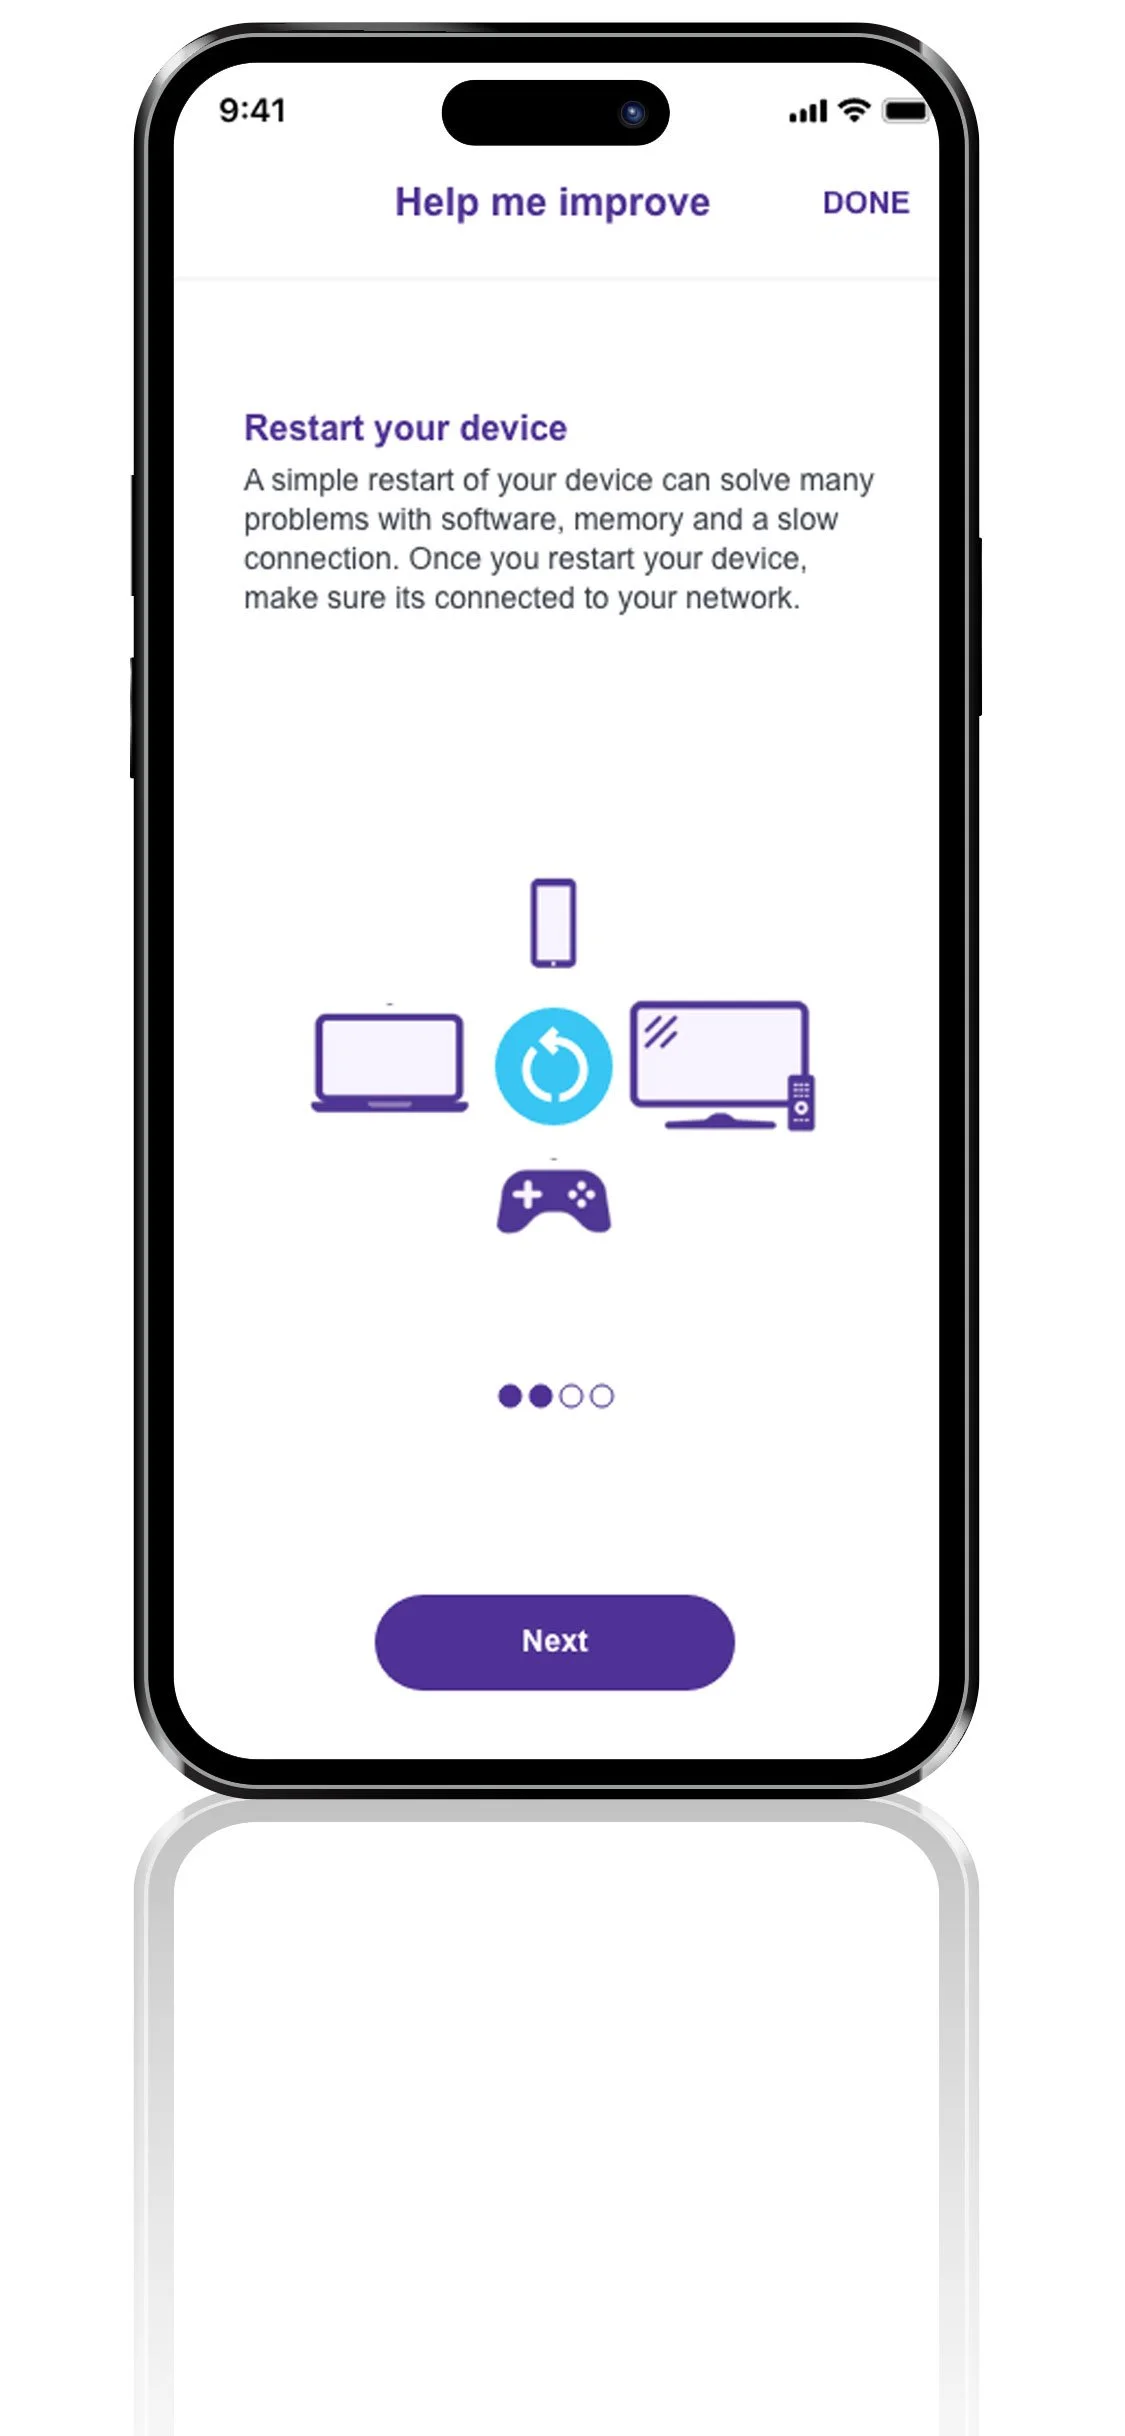
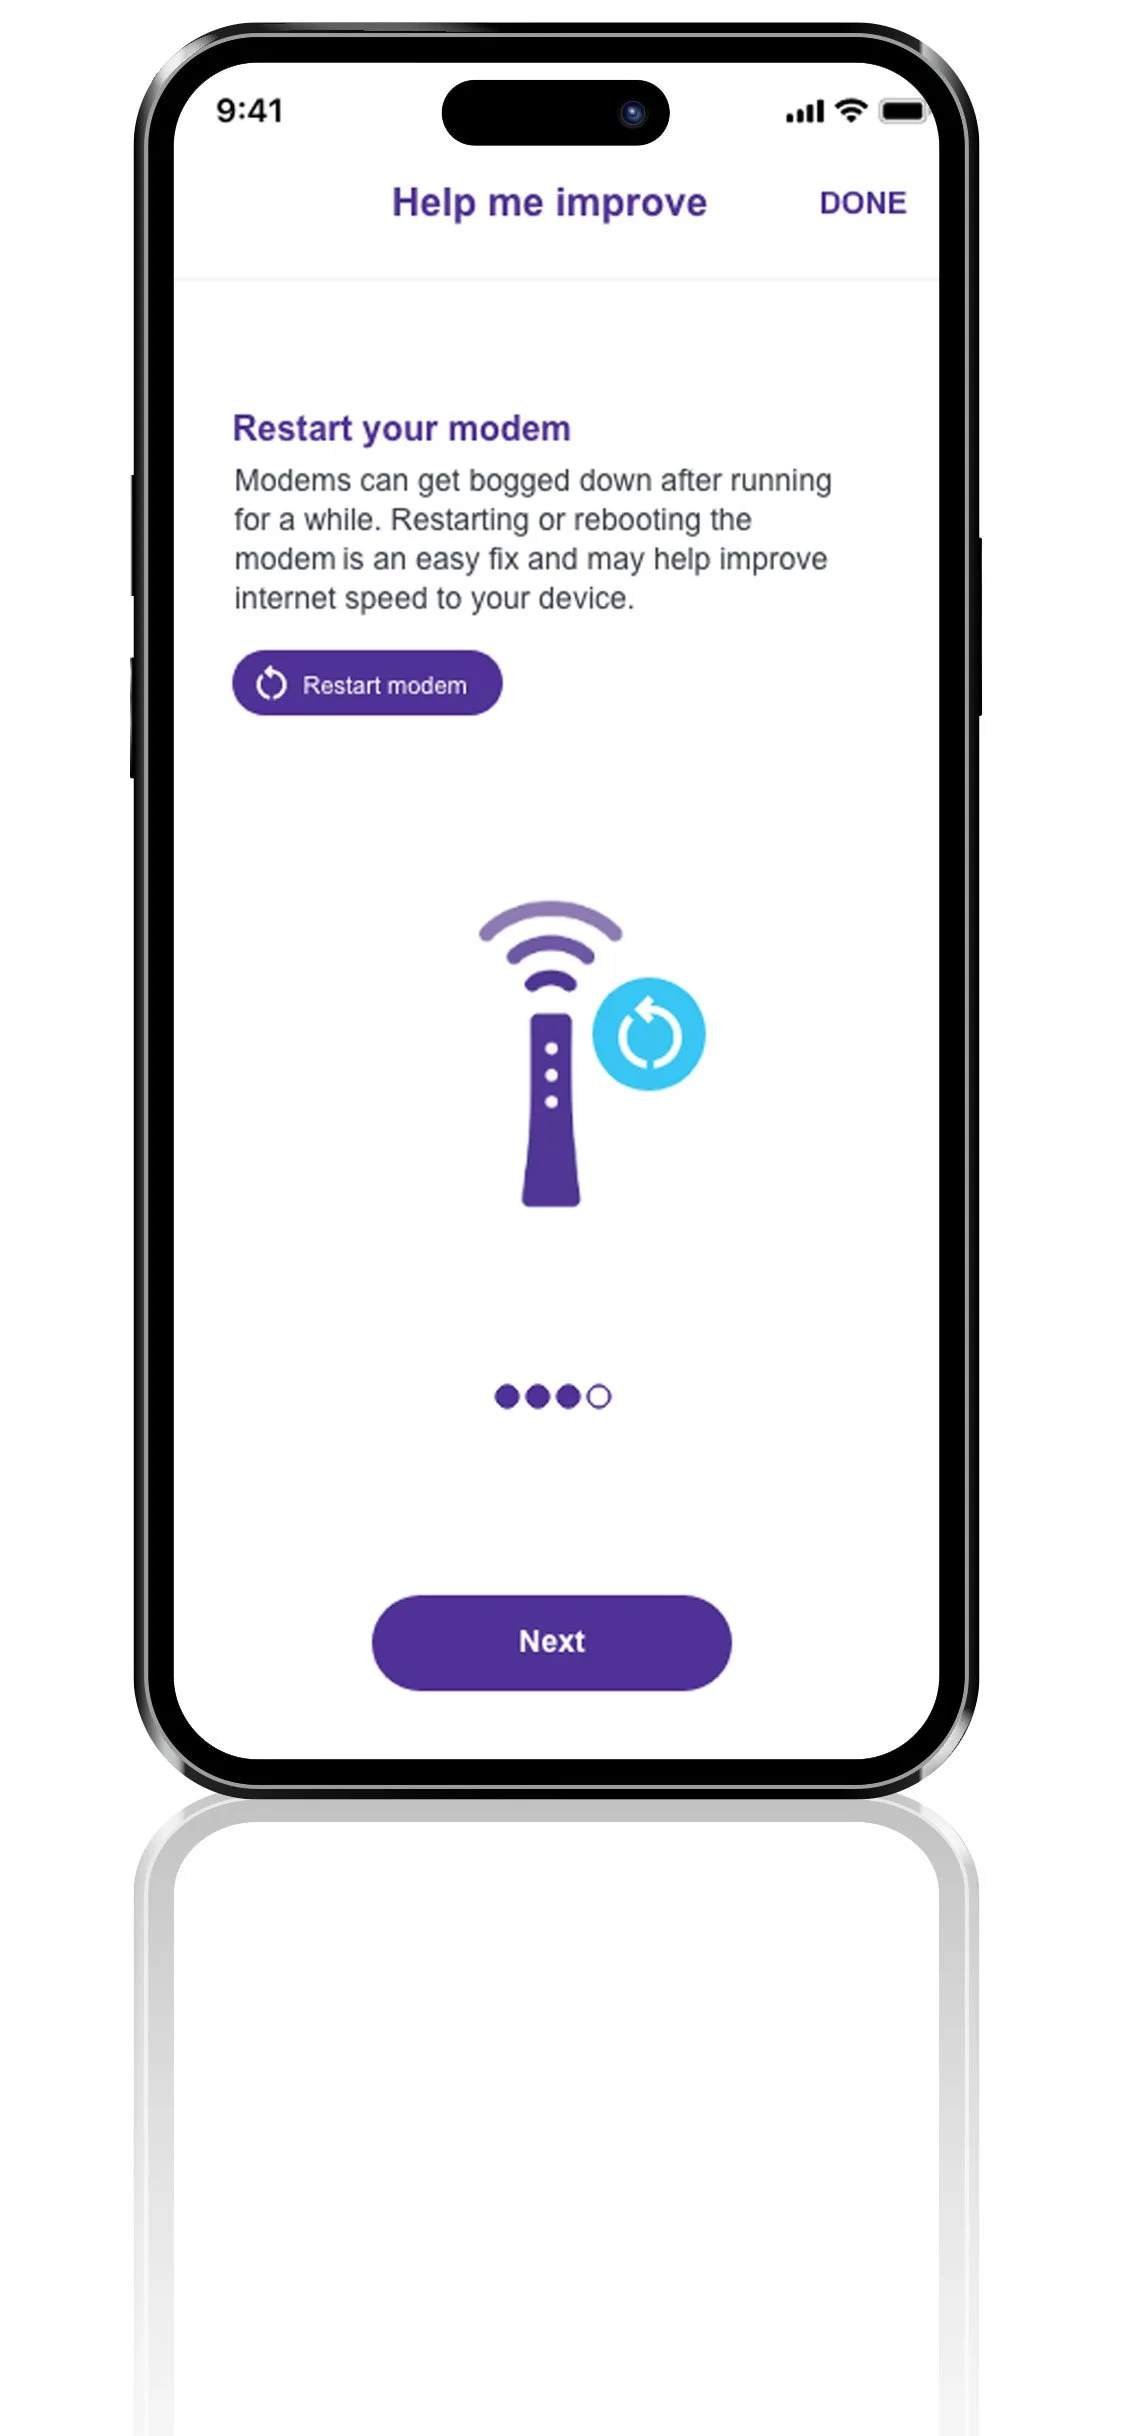
Connected Devices Detail & Troubleshooting
Technical limitations did not allow me to show true speed to devices connected to a network. However, I was able to provide a connection quality indicator and provide guidance on what that quality indicator meant. Customers were given information about what to expect with their connection quality and how to troubleshoot that quality if it was poor or not expected.